5 Ways to Get Value from App Diagrams
Hey all! I’ve heard from many users who are excited about the new App Diagrams feature and wanted to share a few different ways people are using them to improve their daily work.
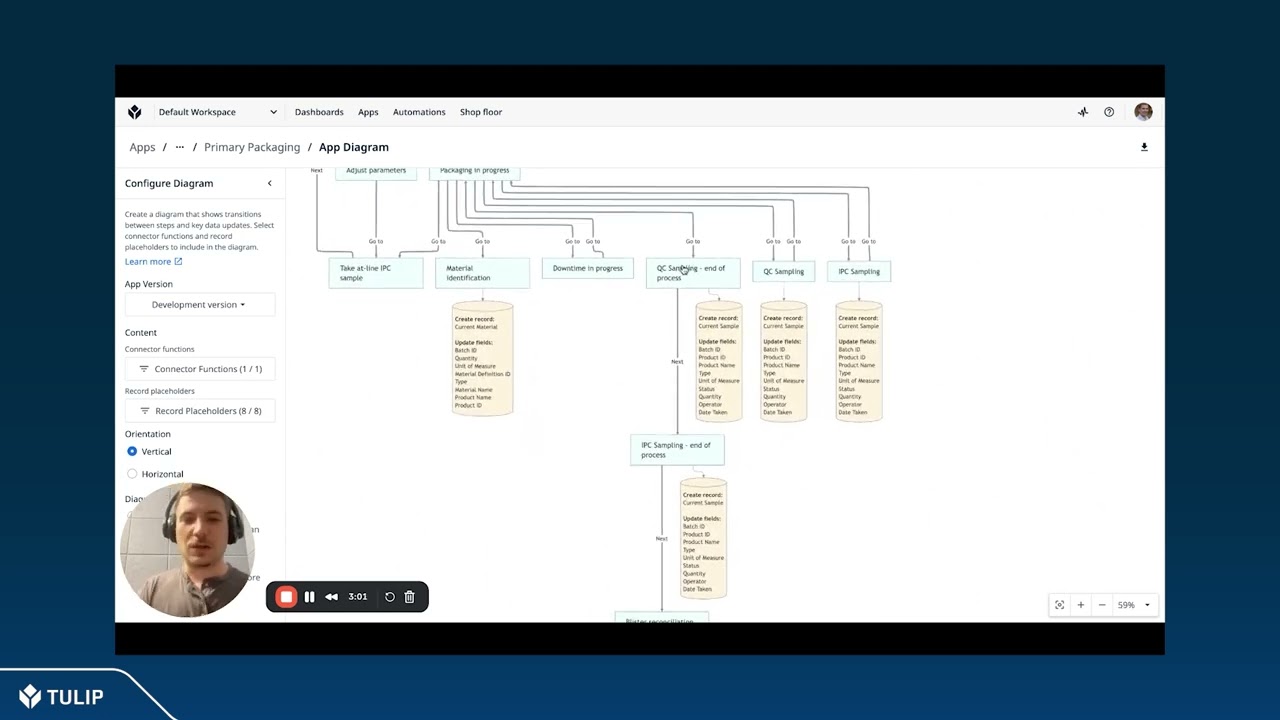
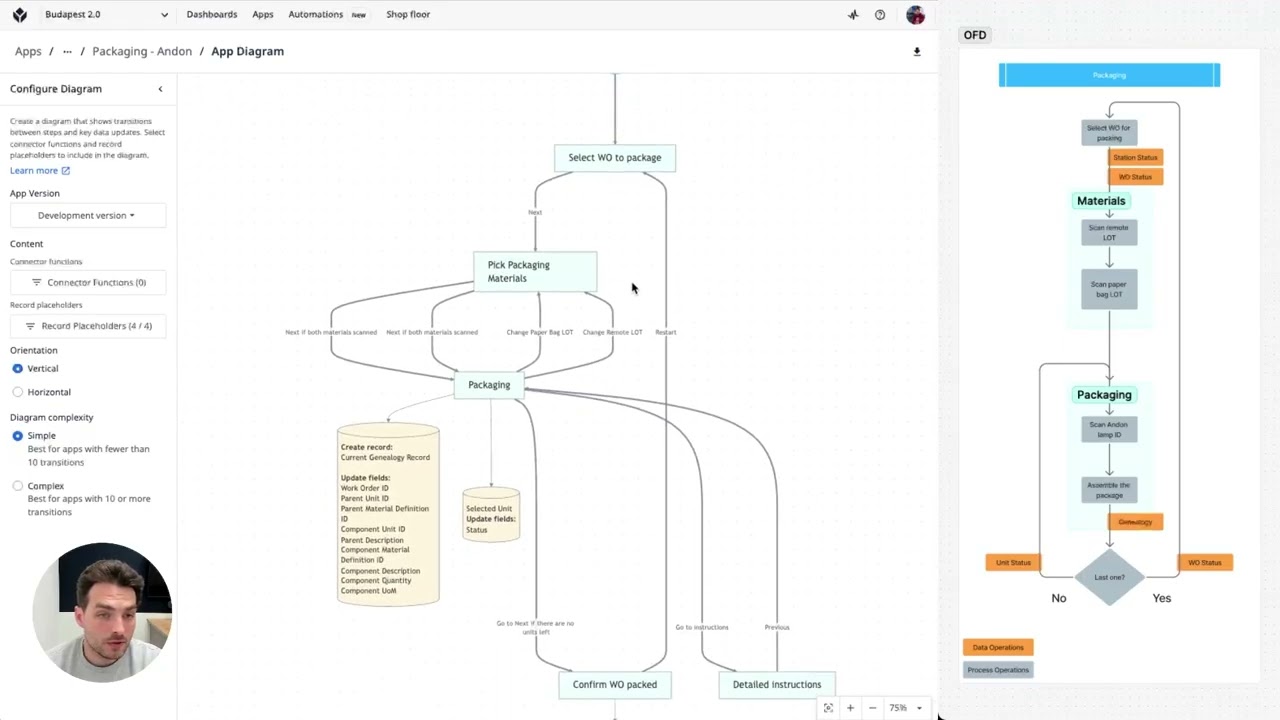
For those who don’t know about App Diagrams yet – this new feature allows you to generate a flowchart of an app’s steps, triggers, transitions, table updates, and connector calls within Tulip. Because this diagram lives in the product, it’s always up-to-date, automatically documenting how your apps work.
Historically, most folks manually documented their apps to help understand and communicate the logic. We wanted to create instant visualizations so that anyone on your team can quickly understand how an app works, no matter who built it. This opens lots of doors to smarter, faster app building and collaboration across teams and sites.
Some of the creative ways that I’ve seen people use App Diagrams (so far):
-
App Design and Wireframing: Plan and wireframe new apps in Tulip with instant updates whenever you make a change, instead of using Visio or Figma. Show the diagram to end users during development to see if the app flow matches the process on the shop floor. (Shoutout to Tulip Partner @BrianHaselton at Low Code OI for this one!)
-
App Investigation and Troubleshooting: Quickly trace app logic and pinpoint problems when debugging (you can stop clicking through “where used” references now…). With immediate visibility into app flows, any team member can step in to maintain and optimize an app across its lifecycle.
-
Knowledge Sharing: App Diagrams accelerate onboarding of new team members and facilitate smooth handoffs to new owners. One user shared that App Diagrams saved “a few to several hours of conversations” when handing off a complex app to a teammate.
-
Instant Documentation: Instantly generate detailed, step-by-step documentation for audits and compliance. We heard from one customer in the Med Device space that App Diagrams helped them reduce the time to document apps from 2-3 days to just 2-3 hours!
-
Collaborative App Building: Visual diagrams keep engineers and process designers on the same page, reducing misunderstandings and accelerating development. This enables better co-development across teams and sites.
Check out this video from @AVeres from Tulip’s Experience Center team testing out the App Diagrams feature for his work on a new demo. He used App Diagrams to quickly understand and configure a Library app to match a new physical process.
The next time you run into one of these situations in your daily work – try out App Diagrams to help and let us know what you think.
You can find more detail on the feature and how it works in our new Blog Post
and the updated Knowledge Base article.

