I have an app making entries into a table which includes the production line name and its specific metrics that its outputting. This is a manual entry app until we put all inspections into tulip.
I would like to know how many lines are active on a given day. How do I compute this? is there like the power bi function Count(distinct) in Tulip. I trying to display this on a dashboard.
The short answer is that this is definitely possible to do, but how you do it depends a lot on how your data is structured. Here’s how I’ve done this in the past.
If I want to see have many of a given entity are active at a time, I create an analytic starting with the COUNT WHERE TRUE Function. Here I used the STATUS field from my table, and used IN PROGRESS as the status I want to look at.
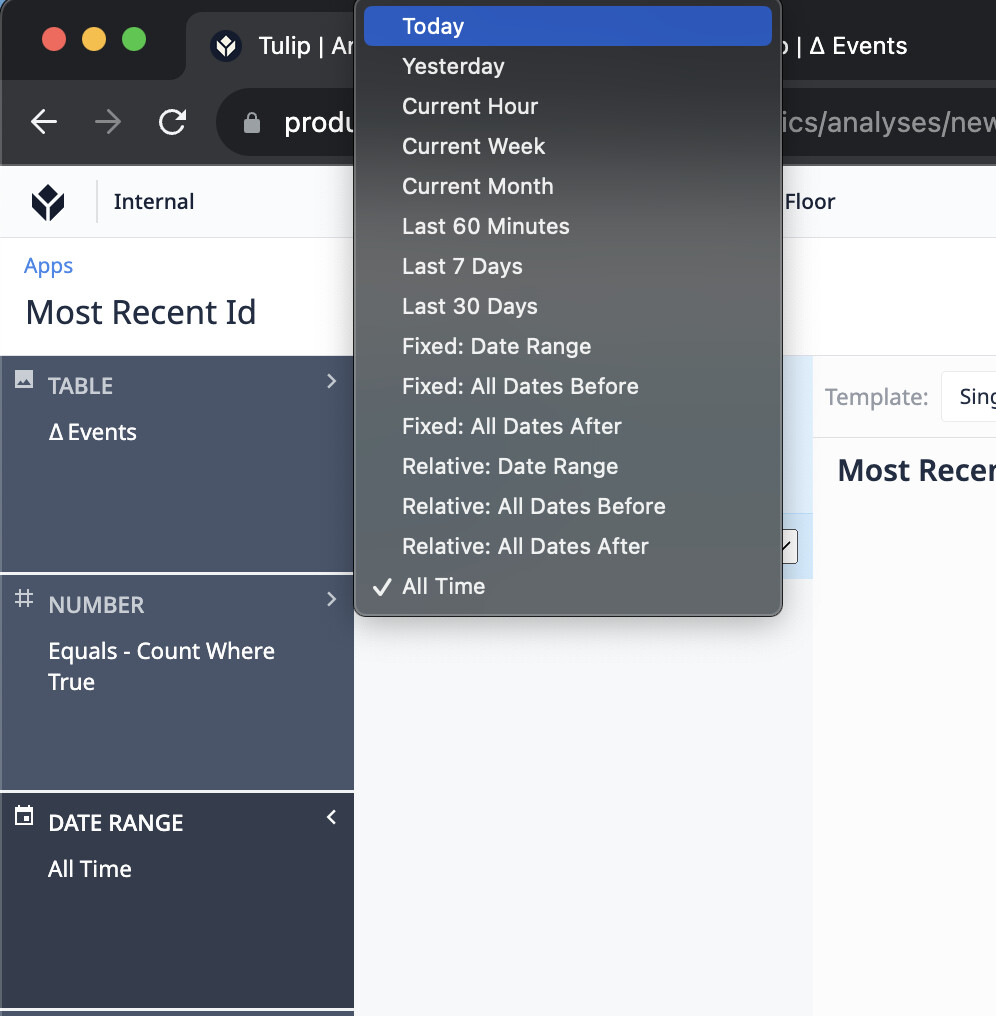
The next step is to specify the time range. I used the built in Date Range tool for this. Here, I can select the range that makes the most sense for me, including Today, Yesterday, or longer periods.