I am building analytics for my first Tulip app and I am looking for a way to sum the same strings in different columns for my analytics. Here is an illustration of what I want to do:

Can I do it without building extra columns for counting strings?
I am building analytics for my first Tulip app and I am looking for a way to sum the same strings in different columns for my analytics. Here is an illustration of what I want to do:
Can I do it without building extra columns for counting strings?
hello @Andres , thanks for posting!!
just to confirm, you you like for each record to count as 1 or for each individual test to count as 1??
you can do this by using the Expression Editor and adding multiple COUNT() Functions. Expression: count(@Column 1 = 'Test 1') + count(@Column 2 = 'Test 1') + count(@Column 3 = 'Test 1')
completions:
if you’d like for individual records that contain “Test 1”, you should be able to use count_where_true(). let me know if you need help building that out!!
I am also looking for a way to show that data as a bar chart. The X-axis should show the different options in cells (in my example Test1, Test2, Test3, etc.).
I tried out the count function in the expression editor, but in my case, the data in my completions or in my table doesn’t match with what the analytics builder shows me.
It would be great if you can help to build that out.
hello @Andres, we can certainly help out!!
could you share a screenshot of the Completions and of the Analytic you’re building??
based on what Im understanding, here is one way you could build it (and adding the remainder for Column 2, and 3):
I think I got little bit closer with the solution.
This is what I got at the moment:
There is still one error to solve before I can say it is solved - analytics doesn’t count the string when it is more than once on a same row. I need it to be taken into account.
I am basically looking the same solution as COUNTIF() function in Excel. Can you send me an example how can I use COUNT() function with matching strings in Expression editor. I haven’t found a solution for that.
Or can I use the app editor to count the number of matching values in Tulip table and store it to another column?
hello @Andres!!
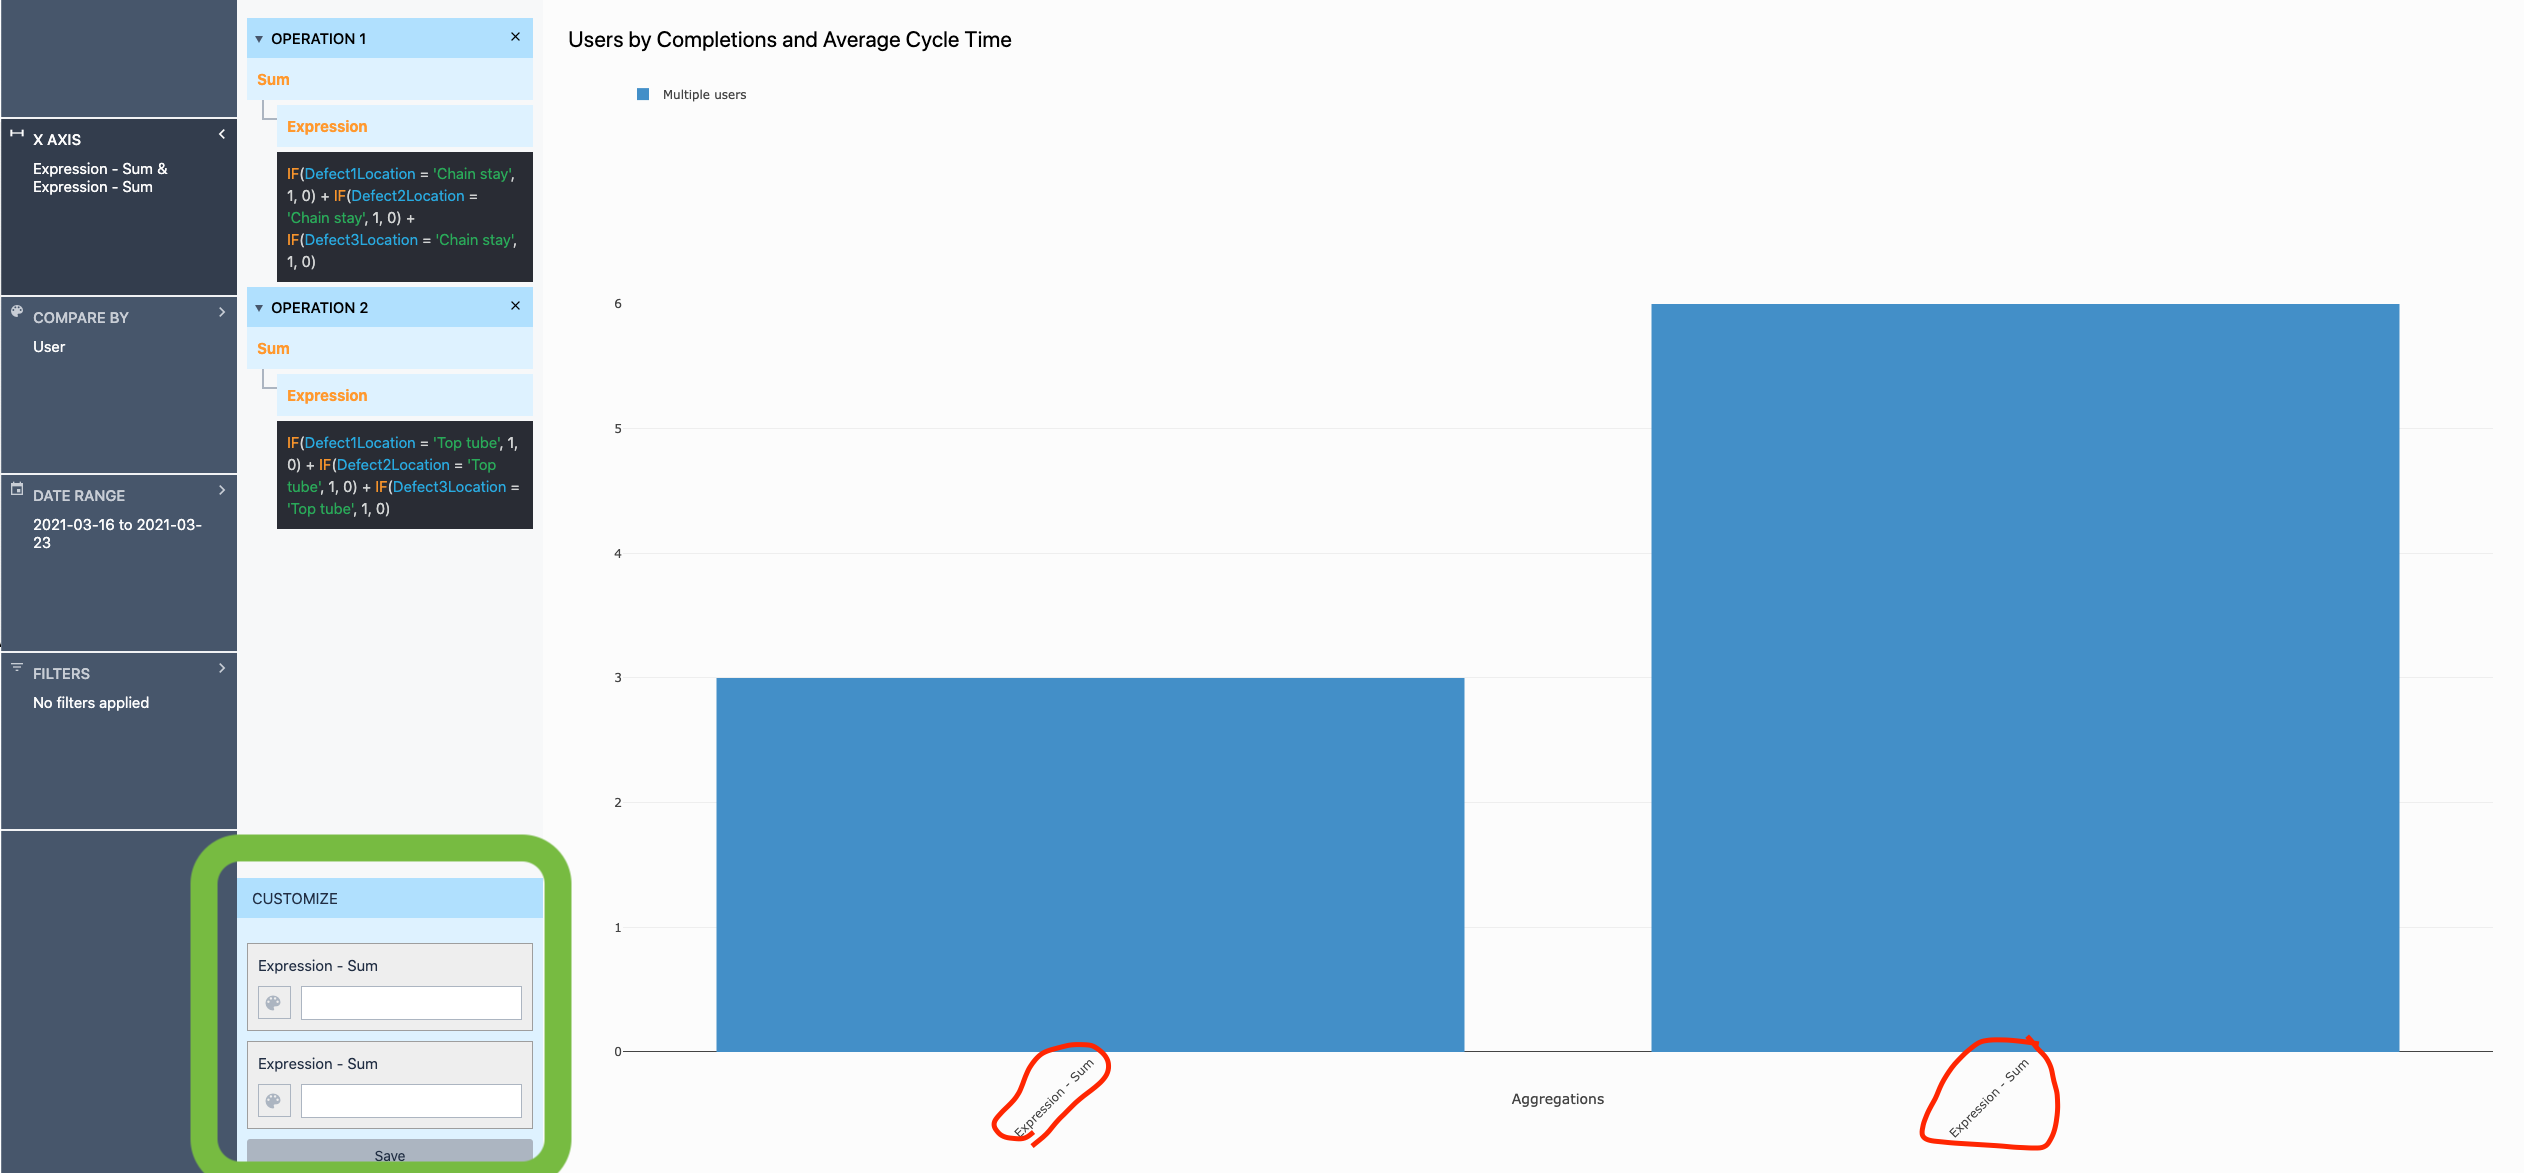
great to see you’re making good progress on the Analytics. to update the column labels, enter them here (optionally changing the color too) and click save:
regarding your other question, have you using the count(@Column 1 = 'Test 1') as you mention?? this should return the number you’re looking:
Test 1:let us know if this helps!!
I got the correct column names but color change doesn’t work. After choosing color and clicking save nothing happens.
Count function also doesn’t work properly. I just tried it out as you showed. Mostly I got the count of completions right but with one data point it didn’t work - I tried it many times and all values from my dataset.
Is it possible to provide some test function to expression editor to test some parts of it?
hello @Andres,
just to confirm, are you clicking Save on the labels prior to saving the entire Analysis?? this is what it should look like:
if that is indeed the case, could you email support@tulip.co the link to the analysis??
regarding the COUNT() function, can you share a screenshot of the Expression you’re using and the Completions tab on your app??
thanks!!