I was looking to build an app that reads the 20 most recent table entries and then displays them on a trend line graph. I noticed that I can read specific table entries, but I can’t figure out how to read a generic (IE most recent) table entry.
hello @Kailey,
great question!!
so, you can build Line Graphs simply Selecting One Operation
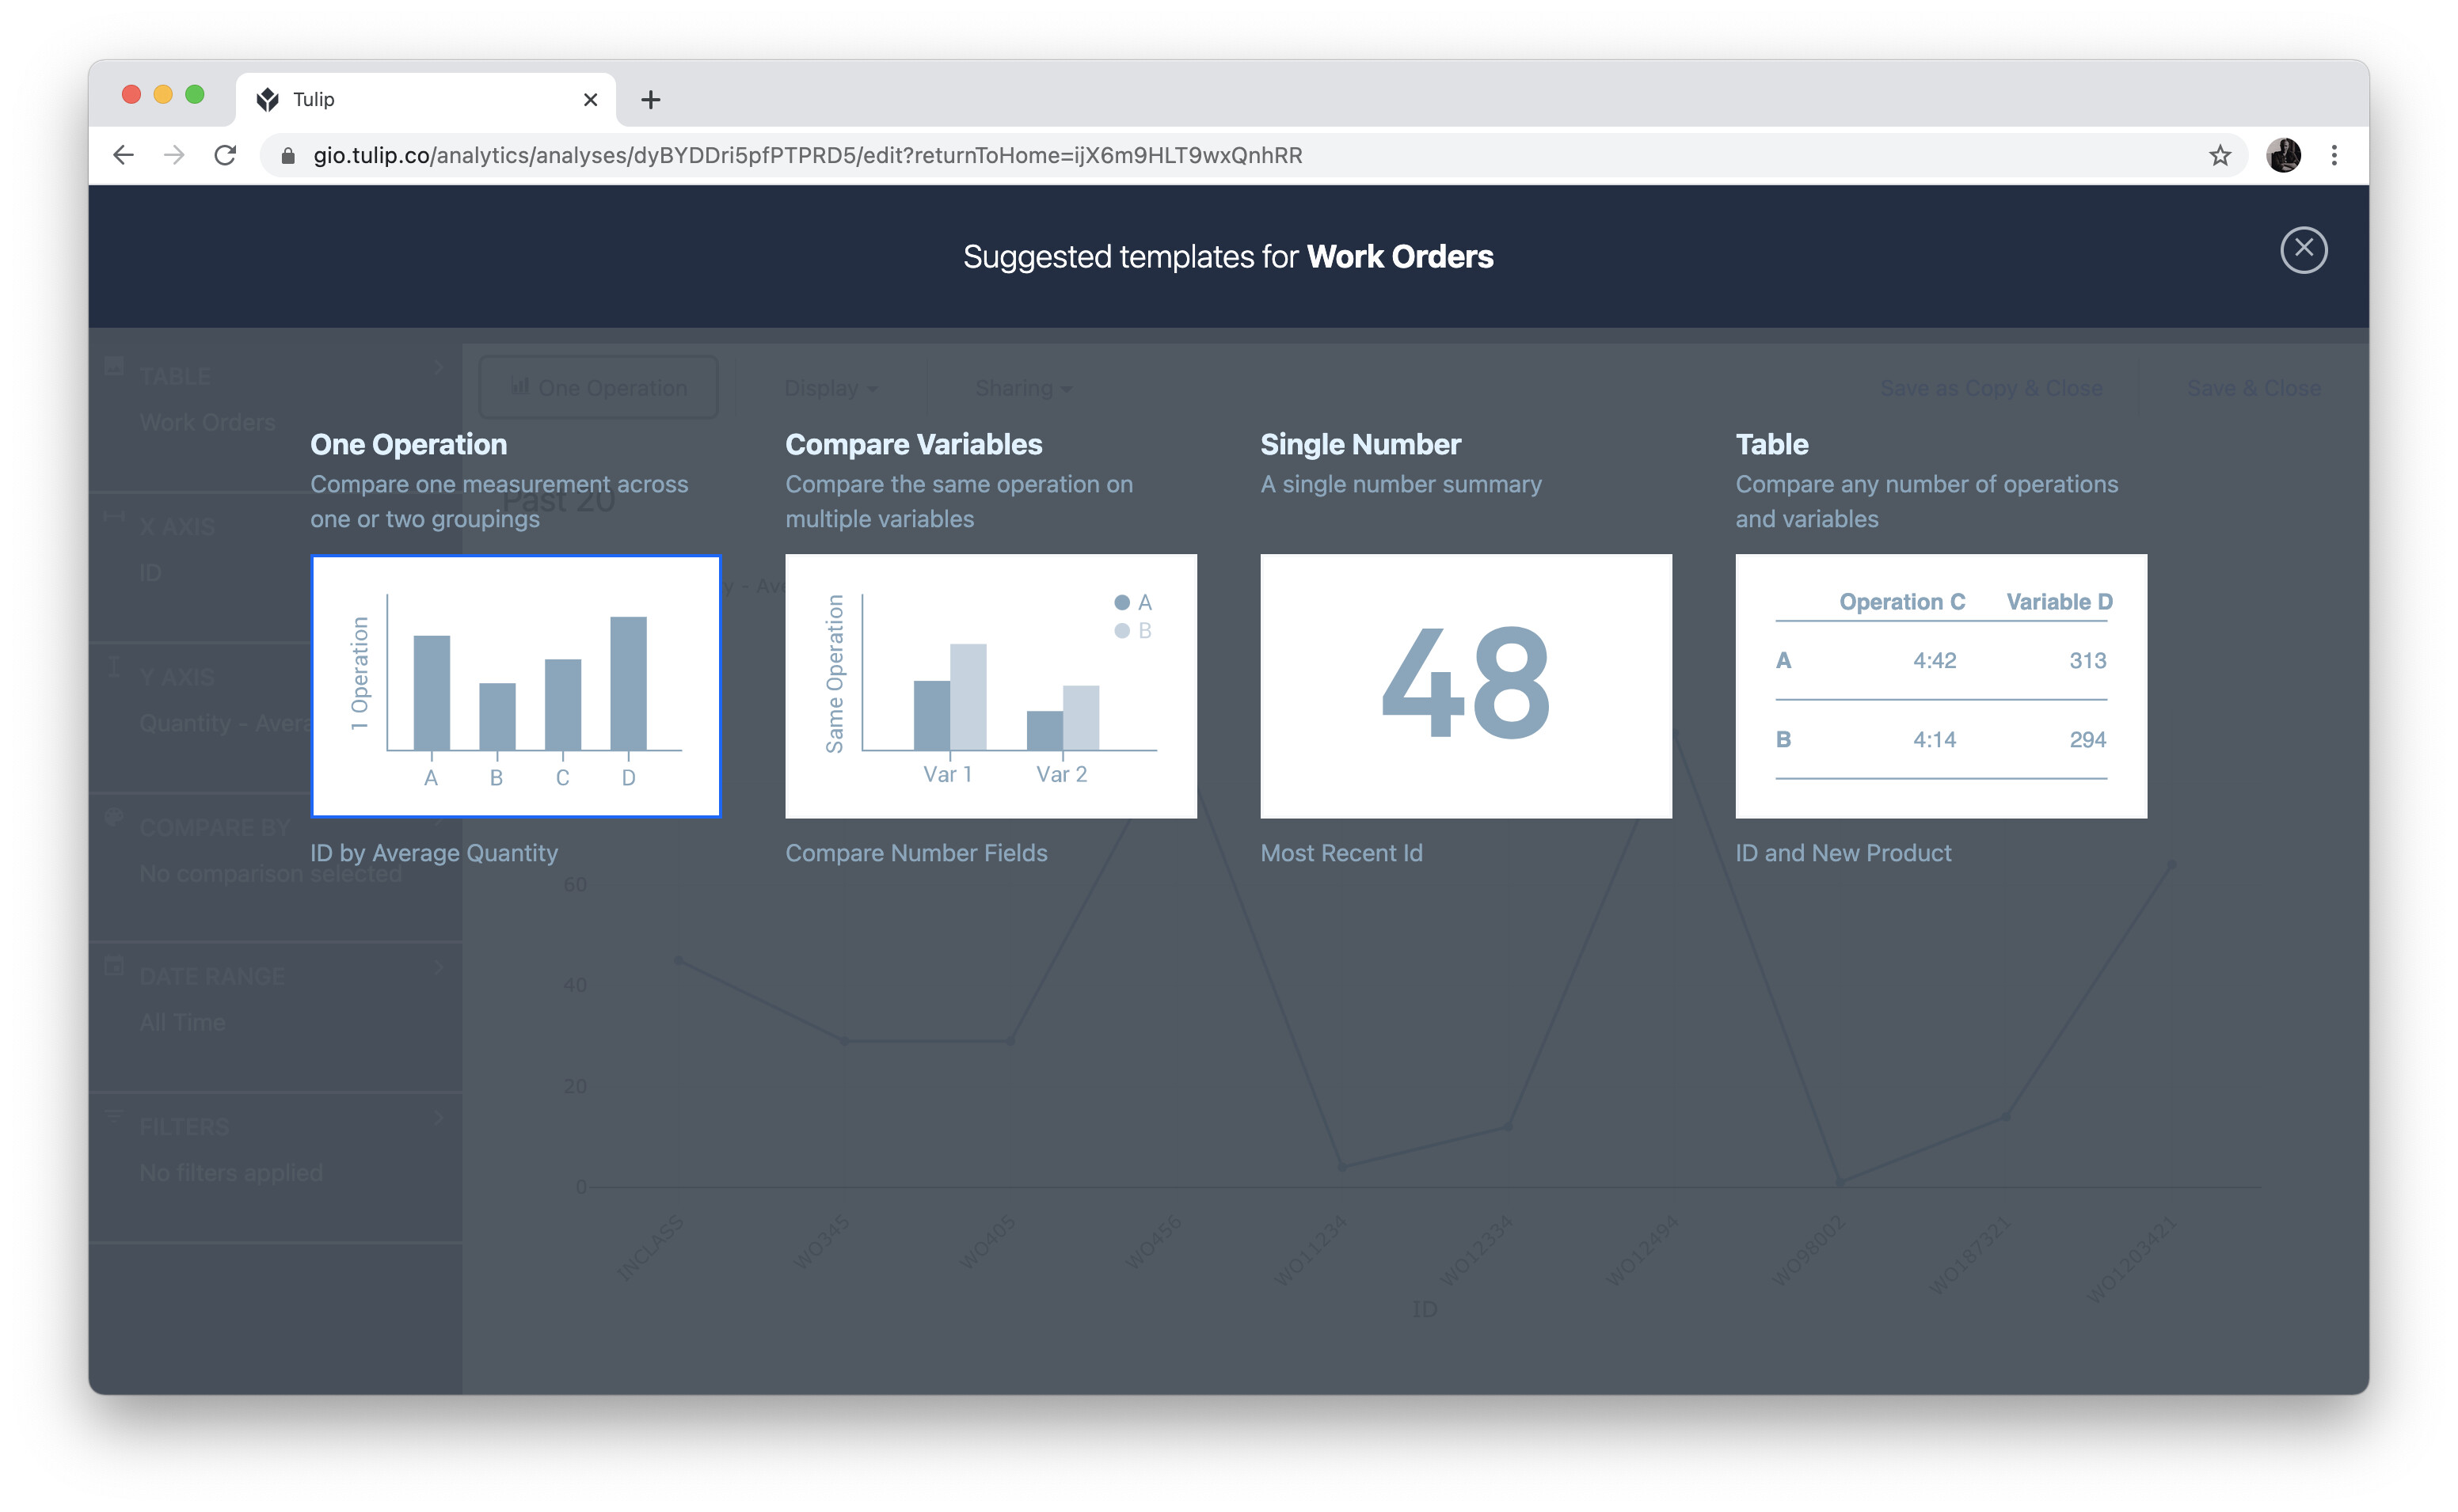
and then, putting the ID along the X Axis, and a Number Field (Quantity in this example) on the Y Axis. please note that the Date Range needs to be all time as it’s looking at when the Record was created:

finally, within your app, you can filter out any Records you want to omit using Filters:

would this work for you?? let us know if we missed something!!